Calendar Year 2023 Climatological Summary
Temperature
Precipitation
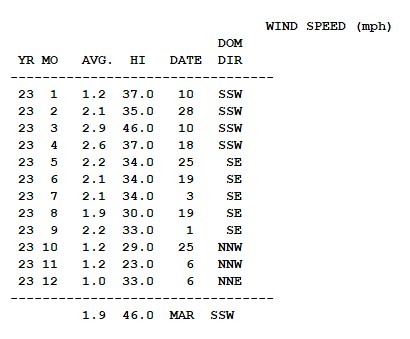
Wind
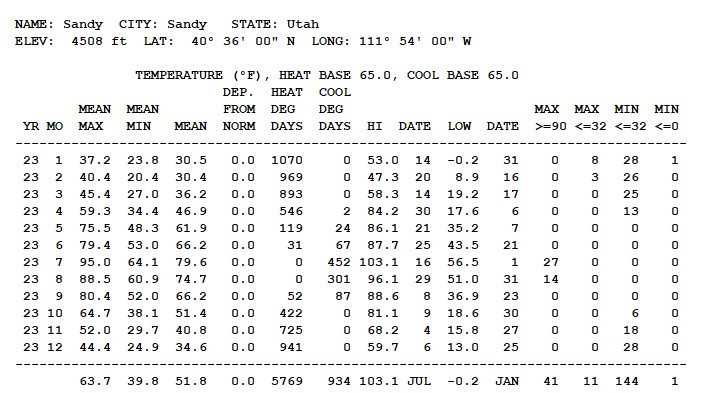
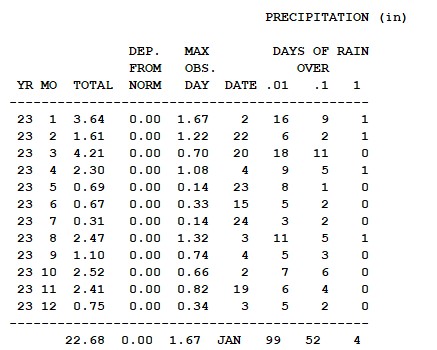
The highest temperature for the yrear was 103.1F on July 16. The lowest temperature for the year was -0.2 F on January 7th. There were no days below 0 F (-which is now commonplace. The total precipitation was well above average at 22.68". The month with the most precipitation was 4.21" in March. The heaviest precipitation in a single day was 1.67" on January 2.
December 2023 Climatological Summary
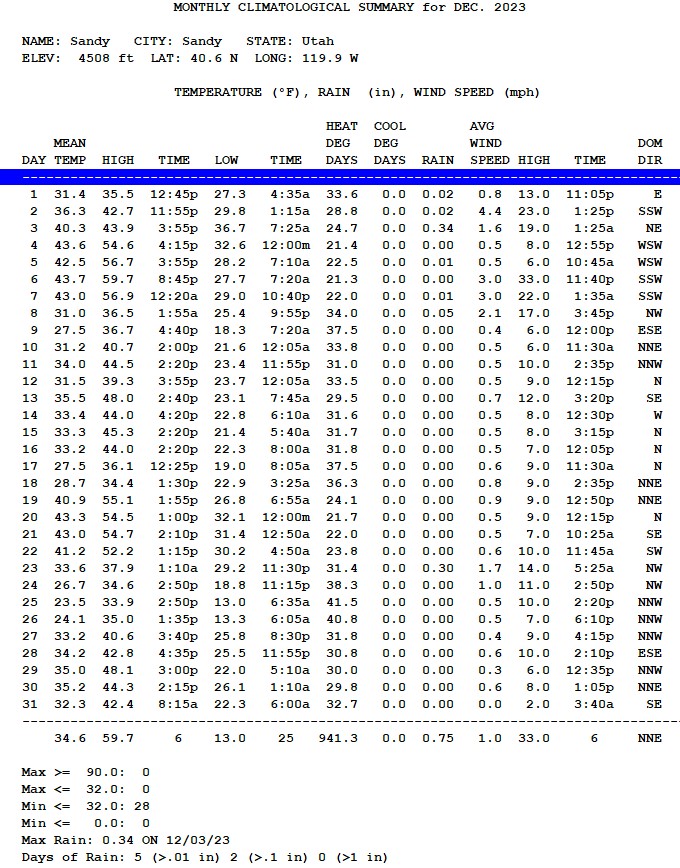
Hot (ok well warm) and dry are the words that describe December 2023. After two months of above normal precipitation, December 2023 was dry with only 0.75" (1.9 cm) of precipitation. It was not the driest December in the last 26 years. That record goes to December 2011 with only 0.5" (0.1 cm). There were just two stormy periods, around December 3rd and 23rd, leaving the month was drier than the normal of 1.87" (4.7 cm).
Without storminess, we had some issues with poor air quality which was significantly mitigated by the lack of snow on the ground. Snow on the ground induces a shallower layer of air near the surface increasing pollutant concentrations. Global warming has and will continue to mitigate our traditional winter air pollution problem. Summertime, as in Los Angeles, will become the bigger issue with ozone pollution.
Not surprisingly the average temperature for December was 34.6 F (1.4 C). That is value is amazingly higher than the twenty-six year average of 29.8 F (-1.2 C).
November 2023 Climatological Summary
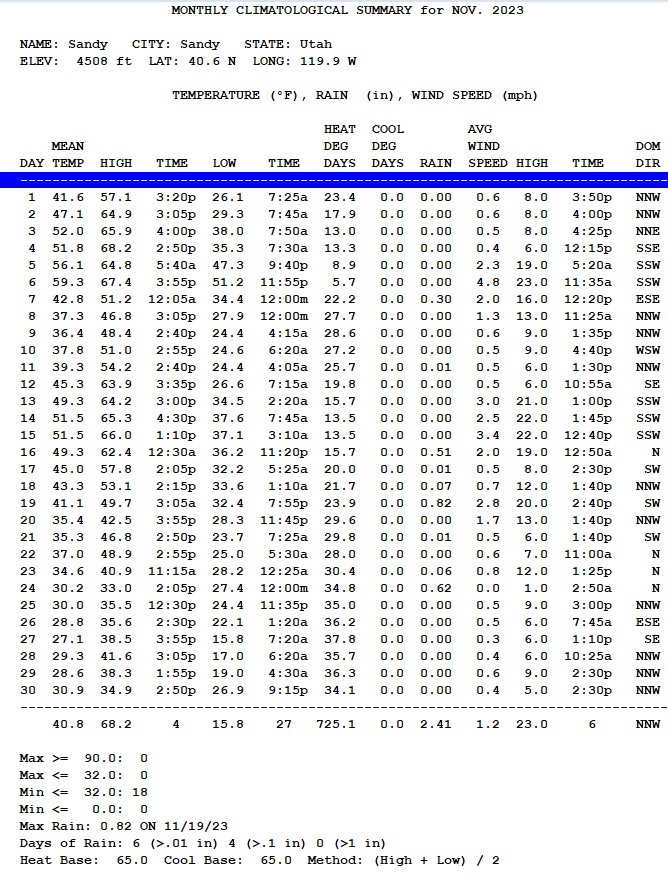
November 2023 was both warmer and wetter than normal. Due to significant precipitation on November 16, 19, and 24, the total precipitation was 2.41" ( cm) versus a 26-year average of 1.43" ( cm). The storm on the 24th brought 3-4" of heavy wet snow (actually twice the water content of normal snow).
The 26-year average for temperature is 39.7 F ( C). The average temperature this year was 40.8F ( C). two full degrees (Fahrenheit) higher than the normal. That's about the same as the global change in temperature since the 1950s.
The storm on the 24th brought enough snow to cover the valley.. With fair weather after that, a strong thermal inversion was triggered and it was easy to see gunk trapped in the atmosphere. That said global warming has produced fewer days of inversion and shorter numbers of consecutive days of gunk in the valley. Global warming is reducing the inversion problem in Utah's lower industrial valleys and will continue to do so into the foreseable future.
My worry about the 2034 Olympic games is not the inversion, it rather the availablity of snow. The Olympics in Korea got through this problem with the ability to make snow, I suspect the Utah games of 2034 may have to do the same thing.
October 2023 Climatological Summary

October 2023 was a bit cooler than normal 51.4 F (10.8 C) versus the 26-year average of 51.9 F (11.1 C). The month was also much wetter than normal with total precipitation reaching 2.52" (6.4 cm) versus the 26-year normal of 1.41" (3.6 cm). October is often dry, but in 2021 4.44" (11.3 cm) was recorded.
The first day of frost was October 26, as a cold front pushed through the area beginning six days of below-freezing temperatures to end the month. High temperatures were below 50 F (10 C) for three days (October 28-30).
The highest temperature this October was 81.1 F ( 27.3 C), well below the all-time record high of 89.1 F (31.7 C) recorded in 2010.
September 2023 Climatological Summary

On average there are three such days over the past 26 years. On September 8 the temperature hit a chilly 36.9 F (2.7 C). The mean temperature this year was 66.2 F (19.0 C). That average is still higher than the 26-year average of 64.1 F (17.8 C). Global warming still rules.
The 26-year average precipitation for September is 1.18" (3.0 cm). The max was 4.34" (11.0 cm) in 2021, and the minimum was 0.00 ( 0.0 cm) in 2019. Most of the rain in 2023 occurred on September 4 as 0.74" (1.9 cm) fell that day. Last year (2022) was dry with only 0.47" (1.2 cm) right before the wet period began and extended well into 2023.
August 2023 Climatological Summary

The American West Desert Monsoon was active in August 2023, providing 2.47" (6.2 cm) of precipitation. More than half of the total was received on August 3 when 1.32" ( cm) was measured. That is not however the most for an August day during the last 26 years. That record is 2.03" (3.4 cm) on August 18, 2021. Three of the four highest precipitation totals for August were in the last three years (2021, 2022, 2023), indicating that the monsoon has been very active in August recently.
The mean temperature for August 2023 was 72.8 F (22.7 C) a full degree above the 26-year mean temperature. Thirteen days had a high temperature above 90 F (32.2 C), which is one day less than the 26-year average of days above 90 F during August.
July 2023 Climatological Summary

The middle to late part of the month was HOT with 17 consecutive days over 90 F (32.2 C) with five of those days over 100 F (37.8 C). The highest temperature was 103.1 F ( 39.5 C) on July 16. That's just one degree below the all-time high at this location of 104.2 F ( 40.1 C) in July of 2002. The average temperature was 79.6 F (26.4 C) versus a 26-year average of 77.0 F (25.0 C). So if you thought July 2023 was warmer than normal you would be correct.
Precipitation was significantly below the average of 1.01" (2.6 cm) as just 0.31" (0.8 cm) fell. The rain was spotty as thunderstorms formed here and there. May June and July have all been below normal.
The American West Desert Monsoon generally starts in late July and can last through late September. This feature occurs as moist air is pulled from off Baja Mexico through Arizona and up into Utah. The short but heavy downpour late in the day on July 24th may have been the announcement of this annual feature.
If you heard someone say the excessive heat this year is due to the return of El Nino, my research says such statements have no basis in fact.
June 2023 Climatological Summary

While the mean temperature of 68.2 F (20.1 C) was just over the 26-year average of 67.9 F (19.9 C) there was never a day where the temperature exceeded 90 F (32.2 C). The normal number of days in June with highs above 90 F (32.2 C) is 7. The mean temperature for June 2021 was 77.4 F (25.2 C), which was a much warmer month than June 2023.
Near normal temperatures, with very few exceptionally hot days in May and June is what allowed for the snowpack in the mountains to melt and generate minimal flooding.
Also, total precipitation in May and June was below normal. June 2023 recorded only 0.67" (1.70 cm) versus a 26-year normal of 1.01" (2.56 cm).
Less than-normal rainfall in May and June also contributed to the lack of any significant flooding. It was the perfect scenario to avoid flooding.
While June 2023 did not feel like summer due to a perpetual but mostly low moisture direct westerly flow from the Pacific Ocean creating afternoon thunderstorms, I hereby decree that SUMMER 2023 starts today - July 1, 2023.
May 2023 Climatological Summary

May 2023 provided something not seen in earlier months of the year. The total precipitation during May was BELOW average, as the month totaled only 0.69” (1.7 cm) of rainfall. The 26-year average for May is 1.83” (4.6 cm). Much of the precipitation came from moisture coming from the south of Southern California and Baja Mexico, which is typical for summer time, but not for May. The Salt Lake International Airport had more rainfall than my home. The storms built over the mountains and then moved north or, at times, northwest.
With less storminess, you might guess that temperatures had a chance to get above normal. That did happen, as the mean temperature for May 2023 was 61.9F (16.6 C). That compares to a 26-year mean temperature of 59.8F (15.4 C). The high temperature was 86.1 F ( C) on May 21st.
We’ve been worried about spring flooding due to the enormous snow depth in our adjacent mountains. Nearby mountains had over 800 inches of snow (20.3 meters). Some flooding has occurred, but nothing like the year 1983. That year was different in two ways. It snowed down the bottoms of the mountains in mid-May 1983, followed by temperatures rising in the 90s. This May provided cool periods followed by warm periods, the perfect scenario to avoid flooding. The excess water has helped the Great Salt Lake, which had been shrinking, to gain 5 feet (1.5 meters) in depth since its low point last fall.
April 2023 Climatological Summary

Winter snow continued in April with a significant snowstorm hitting on April 4th. The t tal was nearly 18" (45.7 cm) at my home, but high in the mountains, it was more than 6 feet (182.9 cm). Little Cottonwood Canyon was closed for days due to the danger of avalanches.
Warm temperatures were limited to April 10-12 and April 27-30. The average temperature for April 2023 was 46.9 F (8.3 C), compared to the 26-year average of 48.0F (8.9 C). Every month so far in 2023 has logged below-normal temperatures.
April 2023 logged 2.30" (5.8 cm) of precipitation, just a bit BELOW the 26-year average of 2.49" (6.3 cm), more than half of which came on April 3rd and 4th. The total for the first four months of 2023 is 11.74" (29.8 cm). That four-month total is more than the full-year total for 2020 of 9.78" (24.8 cm) and 84% of the total for 2022 of 13.94" (35.4 cm). On average, April is the wettest month of the year, followed by March.
March 2023 Climatological Summary

The past five months (starting with November) all had higher-than-normal precipitation. The total for those five months is 14.56" (37.0 cm). The 26-year average for a full calendar year is 18.11" (46.0 cm). So yes you can say the last five months have been incredibly wet in the Salt Lake area. Local ski resorts have totaled over 800 inches of snow (20.32 meters), their highest ever recorded.
Will we have flooding problems in the future months as this snow melts? Some flooding is likely. Will it be like 1983 when streets in downtown Salt Lake City became rivers (probably not unless temperatures stay cool into May and we get rapidly warming temperatures.
The total precipitation for March 2023 was 4.21" (10.7 cm). That is just shy of the wettest March since 1998 when May of 2019 had 4.62" (11.7 cm ). Most of the precipitation this March fell as snow in the valley.
Does this heavy precipitation put an end to the drought? That answer is "No, but it certainly does mitigate it."
The average temperature for March 2023 was 36.2 F (2.3 C), far below the 26-year average of 42.5 F (5.8 C). This confirms that temperatures in March 2023 were well below normal, forcing most of the precipitation to fall as snow.
February 2023 Climatological Summary

February is supposed to be warmer than January, but not this year, it was 30.4 F (-0.9 C) versus 30.5 F (-0.8 C) the prior month. The high temperature for the month was 47.3 F (8.5 C) versus 53.0 F (11.7 C) in January 2023. The 26-year average for February is 34.4 F (1.3 C) 4 F below the average. Some might say well that means the concept of Global Warming is bogus. No, natural variability in the weather is NOT overruled by Global Warming. Global Warming is a long-term trend, not the weather from a single day, a single month, or a single year.
The total precipitation for the month was 1.61" (4.1 cm). just slightly above 1.53" (3.9 cm) which is the 26-year average. A year ago we had the direst February in the last 26 years with only 0.33" (0.8 cm). The heavy snowfall (18" or 45.7 cm) on February 22nd provided 75% of the total precipitation for the month. On average the next three months are the wettest of the year. Hopefully, we can stay near or above normal for these spring months.
January 2023 Climatological Summary
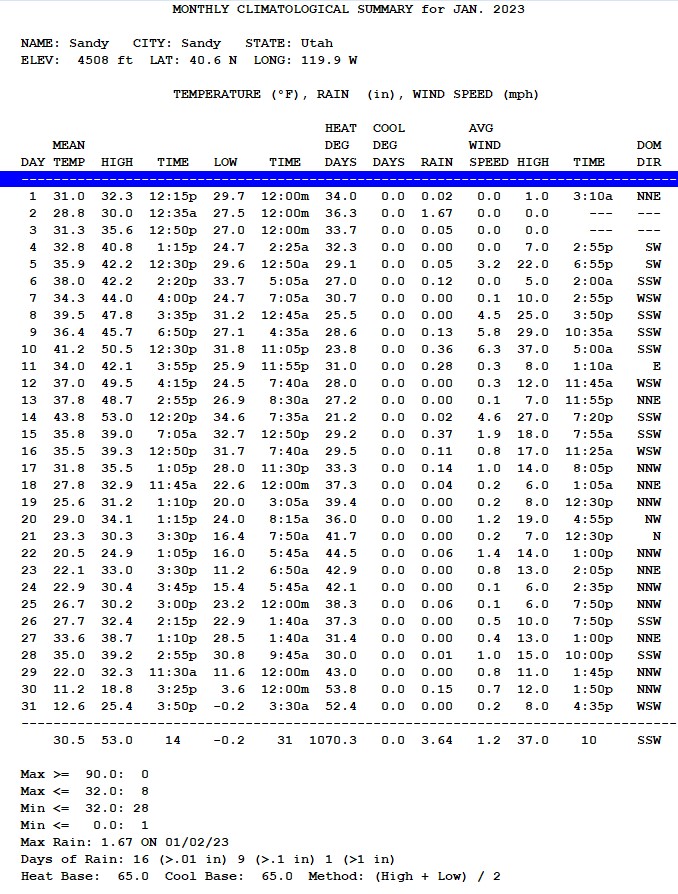
A New Year’s Day Snowstorm dumped over 12” (30.5 cm) of heavy wet snow all over the Salt Lake Valley. It was enough to shut down many Sunday Worship services (including mine). When it melted down, that storm alone provided 1.69” (4.3 cm) of water.
The first eighteen days of the month were warm and wet (versus the averages). An “atmospheric river” flowed in from lower latitudes in the Pacific Ocean across California and into our area. The first eighteen days featured high temperatures above freezing (32 F/O C). This period also accounted for 94% of the month’s precipitation.
The last 13 days of the month were significantly colder. The snow that fell during this period was pure Utah powder, even in the valleys, and contained little moisture. Four days of such snow provided only 0.28” (0.7 cm) water content.
This January precipitation total was 3.64” (9.2 cm), the highest recorded here in 26 years. The direst January was in 2021 with 0.36” (0.9 cm). The total for the last three months is 9.71” (24.7 cm). The first nine months of 2022 provided only 7.85” (19.9 cm).
The mean temperature was 30.5 F ( C), matching the 26-year average. On the last day of the month, the temperature dropped to -0.2 F ( C), the lowest temperature in six years, as the upper-level winds changed to coming straight out of Canada.
So what changed? I’ve said we needed ENSO (El Niño Southern Oscillation) to switch back to El Niño from La Niña. Rather than take my word for this, I will quote here from AEM (a professional meteorological consulting firm – see www.blog.aem.eco). When they reference California, you can include Utah to a lesser extent, as the Sierra Nevada Mountains take much of the moisture out of the air before reaching Utah. Also, see the attached graphic from AEM that clarifies the “atmospheric river.”
Between the final weeks of December and mid-January, California was hammered by relentless rain. Almost all of the state saw 400%-600% more precipitation than usual – with some places getting as much as three feet of rain since Christmas 2022.
Storms of this power, volume, and length are rare but not unheard of, and there’s reason to believe events like these could become more frequent as weather and climate challenges continue to grow. Understanding and analyzing what’s been happening in California this January will be key to protecting coastal communities from the next megastorm.
The size, volume, and impact of this year’s atmospheric river storm was also likely enhanced by the transition from years of La Niña patterns back toward El Niño.
El Niño and La Niña are alternating cyclical weather patterns in the Pacific. During El Niño years, warmer-than-average waters tend to cause warmer, dryer conditions in the Northwest and increased precipitation in the Southeastern United States. During the La Niña cycles, waters off the California coast are cooler than average, leading to dry air blowing across the U.S. from west-to-east, reducing rainfall for most of the continental U.S. while leaving the door open for major storms in the Pacific Northwest.
Are the California floods and recent droughts connected?
In short, yes. The droughts and flooding share a key underlying cause: an extended La Niña that has been a key factor in the western megadrought, followed by an abrupt shift back toward El Niño. Long-term drought also increases the risk of flooding generally, as dry ground is less able to absorb precipitation, significantly increasing pooling and runoff.
Back on December 1 of last year, 85% of California was classified as being in severe drought. As of press, that number has fallen to 46%. This abrupt transition between drought and flood has actually created a major water management challenge for communities across California, as it’s unclear how much of the recently fallen waters they should attempt to store and retrain.

1998-2022 Precipitation Summary

Here's the data on 25 years of observations at my location in Sandy, Utah. The maximum is 25.81" (65.6 cm) in 2010. The minimum is 9.78" (24.8 cm) in 2020. The average over those 25 years is 18.15" (46.1 cm)